
Introduction:
Data Analytics:
Data analytics refers to the systematic computational analysis of raw data in order to generate conclusions about that data and make better decisions. Depending on the complexity of the analytics, algorithms based on statistical and mathematical knowledge may be used. Although sounding very similar to analysis, analytics has a different meaning. Analysis refers to the interpreting of past data and information in order to understand the current situation while analytics is about using historical data in order to better predict future trends and outcomes.
Importance of Analytics in Project Management:
Analytics is essential for project managers in order to ensure the project is both on schedule and on budget. Effective project management involves the efficient management of project challenges and risks. This demands project managers to use analytical methods to track and control risks, as well as estimate project schedules and costs through analysis powered by analytics. Today due to such a high level of availability of analytical technology project managers can use the analytical paradigm to break down mass levels of complex information to predict trends and behaviors. This predictive information allows project managers to then better understand the trends, patterns and also to gauge how the project is performing. Project management analytics can help teams ensure that projects are completed on schedule and as specified. Additionally, analytics can help a project manager determine the feasibility of multiple solutions to eliminate unforeseen issues.
How Project Managers Can Best Use Analytics:
Some of the main uses of analytics in project management are as follows:
- Assessing Feasibility – Analytics can be used to evaluate the feasibility of different alternatives so that a project manager can choose the best option.
- Managing Data Overload – Due to the current internet era, data overload has overwhelmed project managers’ abilities to collect useful information from vast amounts of data. Analytics enables project managers to resolve this issue.
- Enhancing Data Visibility and Control via Focused Dashboard – An analytics dashboard enables project managers to look at the big picture and assess how the project is doing and also how the project team members are doing. This information is crucial for prioritizing project tasks and determining how to maximize productivity.
- Analysing Project Portfolios for Project Selection and Prioritization – Project portfolio analysis is a valuable application of analytics. This involves evaluating a large number of project proposals and selecting and prioritizing the most viable ones within the constraints of organizational resources and other relevant factors.
Each organization may differ in the approach that they take regarding the use of data analytics and an organization may even have different approaches for each project. The approach that an organization takes depends on a number of factors, such as project size, project complexity, available resources, the organizational structure, and the experience and skills of the project manager.
3 Common Approaches to Analytics in Project Management are:
- Statistical Approach
- Lean Six Sigma
- Analytic Hierarchy Process
Statistical Approach
The statistical approach is useful when dealing with project challenges as it provides methods and strategies that managers can use to analyze particular trends in project management process data in order to more accurately forecast the future. When a process is performed repeatedly over time the quantitative measure of that process will most likely follow a specific frequency pattern of occurrence. Statistical analysis can aid project managers predict the performance of certain processes and systems. The following probability distributions are used within a statistical approach to analytics in project management:
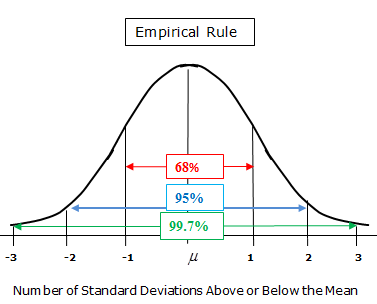
- Normal Distribution – This is the most common probability distribution and is also referred to as a “bell curve” due to its shape and sometimes Gaussian distribution. It is a symmetric distribution with the vast majority of observations clustered around the mean at the center with the probabilities for values diminishing the further away from the mean you go. A large number of processes relating to project management follow this distribution. For normally distributed data there exists a rule known as the Empirical Rule which states that:
- 68% of the data falls within one standard deviation of the mean.
- 95% of the data falls within two standard deviations of the mean.
- 99.7% of the data falls within three standard deviations of the mean.
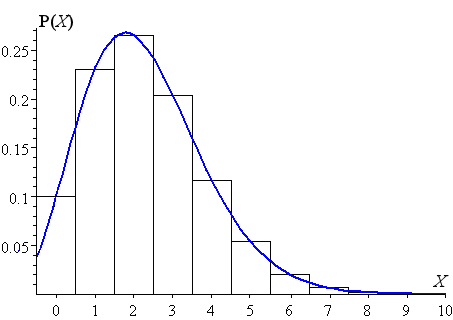
- Poisson Distribution – This expresses the probability of a given number of events happening at a specified time or space interval if these events occur at a known constant mean rate and independent of the time since the last occurrence. This can be used for example to count the number of project milestones completed over a certain. Here you can see a typical Poisson distribution curve.
- Uniform Distribution – This is also known as rectangular distribution and is a probability distribution that has constant probability. For continuous random variables, the area under the curve will always equal to 1. This distribution is suitable where there is an arbitrary outcome that lies between certain bounds. This simplest estimation method helps project managers to turn subjective data, particularly in risk management, into probability distributions for better decision-making.
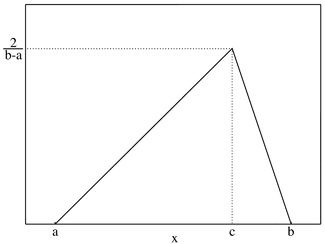
- Triangular Distribution – This distribution is used in project management when there is a lack of historical data to estimate a duration. The triangular distribution is based on three underlying values: a (minimum value), b (maximum value), and c (peak value) and can be used to estimate the minimum, maximum, and most likely values of the outcome. This acts like an optimistic, pessimistic, and realistic estimation for project managers.
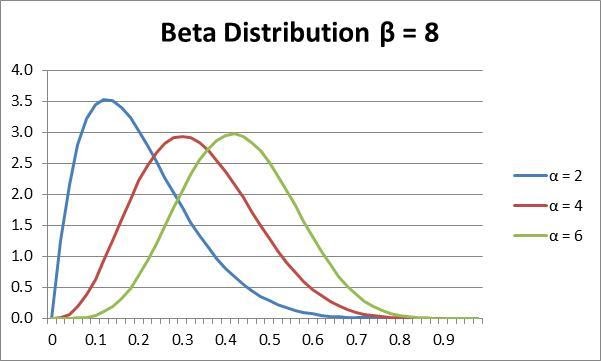
- Beta Distribution – Similar to the triangular distribution, the beta distribution uses the three-point technique to calculate uncertain projected time estimations. Two parameters are required, one determines the center and steepness of the hump while the other determines the shape and fatness.
Lean Six Sigma Approach
Lean six sigma is a disciplined, statistical-based, data-driven approach and the methodology of continuous improvement to eliminate defects in a product, process or service. In project management this could refer to reduction in waste and reduction in accuracy. Decisions should then be made with this in mind.
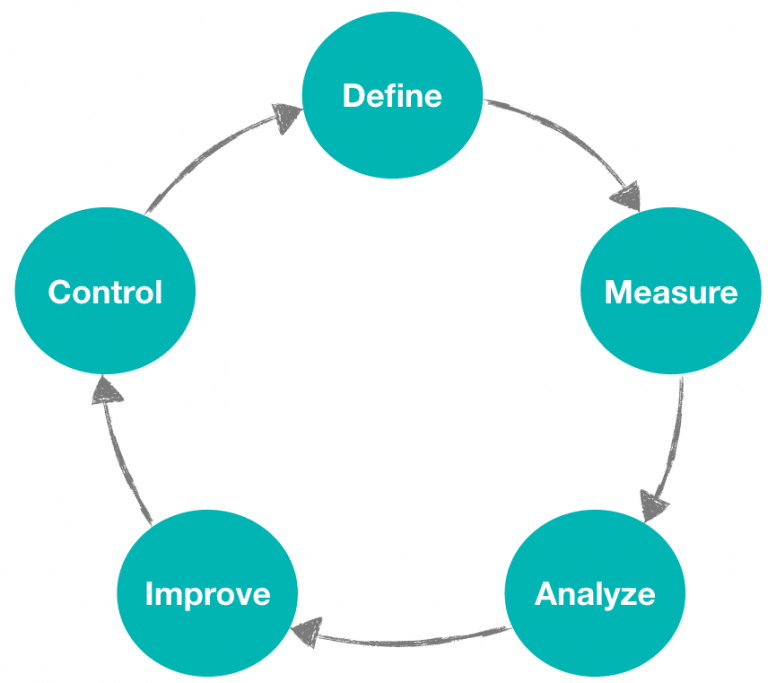
- The DMAIC Cycle – DMAIC which is an acronym for Define, Measure, Analyse, Improve, and Control is a data-driven improvement cycle used for improving, optimizing, and stabilizing. The DMAIC cycle is an essential part of the Lean Six Sigma approach. All steps in the DMAIC Cycle are required and must be completed in order.
- Define: Define the problem
- Measure: Establish a baseline to measure current performance against and determine the desired future performance.
- Analyse: Analyse observed data and identify the root cause for elimination.
- Improve: Identify solutions to eliminate the root cause and improve the process
- Control: Control the changes for sustainability.
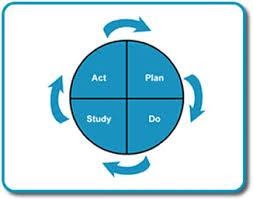
- The PDSA Cycle – Another core aspect of the Lean Six Sigma approach is the PDSA Cycle. PDSA is an acronym for Plan, Do, Study, Act. This is another model for improvement and also provides a framework for developing, testing and implementing the changes that lead to the improvement.
- Plan: Planning the change to be implemented.
- Do: Carrying out the change.
- Study: Collect data before and after the change and analyze the impact.
- Act: Plan the next change or modify the previous change.
The Lean Six Sigma approach can be used in a number of ways in project management to assist project managers with the most notable examples being:
- Schedule Delays
- Cost overruns
- Project scope creep
- Process variation
Analytic Hierarchy Process
The Analytic Hierarchy Method (AHP) is a systematic methodology focused on mathematics and psychology for arranging and evaluating complex decisions. It was developed in the 1970s by Thomas L. Saaty, who collaborated with Ernest Forman in 1983 to create Expert Choice, and has since been widely researched and refined. Saaty believed that both tangible and intangible factors should be taken into consideration when making decisions. The AHP approach can be used is any situation that includes multiple factors in decision making for example deciding which project to include in the portfolio. AHP assists the decision maker select the option that best suits their goal. AHP includes both subjective and objective criteria and the decision makers must then evaluate the trade offs that take place with each decision. AHP can then assist project managers with decisions such as:
- Project resource allocation optimization
- Project risk identification and assessment
- Project selection and prioritization
Conclusion:
In conclusion analytics can play a crucial role in helping project managers make better decisions for the future with the use of predictive information. Project managers can use analytics in any of three approaches mentioned (Statistical Approach, Lean Six Sigma Approach and Analytical Hierarchy Process Approach) to assist them to make these decisions.