Introduction
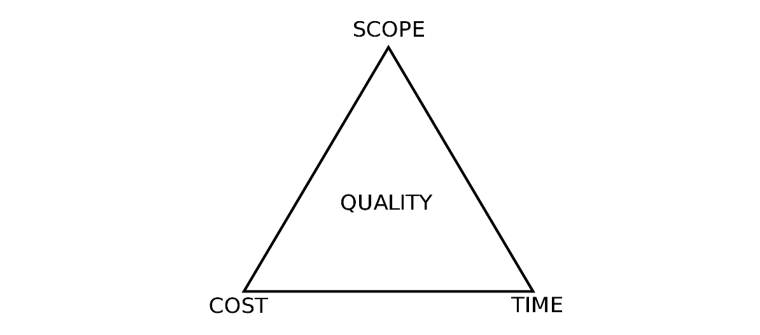
Earned value management (EVM) is a performance management process used in the project management industry to measure the progress and performance of a project against the project baseline. EVM monitors and controls the three constraints of a project, which are scope, time, and cost to help to identify variances in projects between work performed and work that was planned to be performed. Some well-known institutions that practice EVM include NASA, Project Management Institute (PMI), and the United States Government

Components of Earned Value Management:
The three main components of Earned Value Management are:
Planned Value (PV):
Planned value is the first element of earned value management. This refers to the amount of work expressed either in hours or money, to be completed in a given timeframe. It is also sometimes referred to as the budgeted cost of work scheduled. This is the approved budget for the work to be completed which means the cumulative PV for the entire project is simply the budget at completion (BAC). The planned value is calculated as follows: (Planned % Complete) X Budget at Completion. Planned value is then used to help calculate schedule variance and schedule performance index.
Earned Value (EV):
Earned value can also be called the budgeted cost of work performed. This is the work that has been completed thus far and is calculated by multiplying the % that is completed for each task by the planned value. It shows how much of the budget should have been spent, considering the amount of work completed so far and the baseline cost of the job, assignment, or resources. Earned value allows project managers to compare the amount of work that has been completed with the amount of work that was planned to be completed. Earned value is calculated as follows: (Actual % Complete) X Budget at Completion. Earned value is essential to calculate numerous measures such as schedule variance, cost variance, schedule performance index, cost performance index, estimate at completion, and complete performance index.
Actual Cost (AC):
The third component of EVM is actual cost. Actual cost refers to the total cost of the work that has been completed and is often called the actual cost of work performed. In other words, it is the amount of money spent on the project to date. Cost variance and cost performance index are calculated with the use of actual cost.
Earned Value Management Measures:
Budget at Completion
Total Cost of Project
Budgeted Cost for Work Scheduled/Planned Value (PV)
Amount expressed in money (or hours) of work to be performed as per the scheduled plan. (PV = BAC% of planned work)
Budgeted Cost for Work Performed (BCWP)/Earned Value (EV)
Amount expressed in money (or hours) on the actual work performed. (EV=BAC% of Actual work)
Actual Cost of Work Performed (ACWP)/Actual Cost (AC)
The sum of all costs accrued for a task to date.
These are the primary data points that EVM is consisted of. There are also derived data points as follows which allow project managers to analyze the project performance in greater detail.
Derived Data Points:
Estimate at Completion (EAC)
Expected Total Cost required to finish complete work
EAC = BAC/CPI
=AC + ETC
=AC + ((BAC – EV)/CPI) <- Typical Case
=AC + (BAC – EV) <- Atypical Case
Estimate to Complete (ETC)
The expected cost required to finish all remaining work
ETC = EAC – AC
=(BAC/CPI) – (EV/CPI)
= (BAC – EV) / CPI
Variances:
Cost Variances (CV)
How much is under or over budget
CV=EV – AC
Negative is over budget, Positive is under budget
Schedule Variances (SV)
How much ahead or behind schedule
SV=EV – PV
The negative is behind schedule, Positive is ahead of schedule
Variance at Completion (VAC)
The variance of the Total cost of the work and the expected cost.
VAC=BAC – EAC
Performance Indices:
These indices give the project manager a clear figure which gives a definitive answer on how the project is performing.
Cost Performance Index
CPI = EV/AC
Over (<1) or under (>1) budget
Schedule Performance Index
SPI = EV/PV
Ahead (>1) or behind (<1) schedule

Earned Value Management Example:
The best way to understand earned value management is to see a worked example:
Imagine a project which has been approved for a duration of one year with a budget of $12 million dollars. It is agreed that the budget will be spent equally each month. After 3 months the project manager finds that only 10% of the work has been complete and that a total of $2.5 million dollars has been spent.
The Earned Value Management Solution to this problem would be as follows:
Planned Value = $3 million
Earned Value = $12 million * 0.1 = $1.2 million
Actual Cost = $2.5 million
Cost Variance = Earned Value – Actual Cost = $1.2 million – $2.5 million = -$1.3 million
Cost Variance % = 100 * (Cost Variance/Earned Value) = 100*(-1.3/1.2) = -108% overrun
Schedule Variance = Earned Value – Planned Value = $1.2 million – $3 million = -1.8 months
Schedule Variance % = 100 * (Schedule Variance/Planned Value) = 100*(-1.8/3) = -60% behind
Cost Performance Index = Earned Value / Actual Cost = 1.2/2.5 = 0.48
SPI = Earned Value / Planned Value = 1.2/3 = 0.4
Estimate at Completion = Budget at Completion / Cost Performance Index = 12/0.48 = $25 million
Estimate to Completion = (Budget at Completion – Earned Value)/Cost Performance Index = (12-1.2)/0.48 = $22.5 million
Time to complete = (12-1.2)/0.4 = 27 months
The result is that this project will take $25 million and 30 (27+3) Months to complete.
Benefits of Earned Value Management:
- Variance – Variance in EVM is an analysis of what has created a difference between the projected baseline and the actual performance. The variation discovered shows how far behind or how far ahead the project is from what is expected.
- Performance Indices – Another benefit of EVM is that enables the project manager to calculate tools such as the schedule performance index (SPI) and the cost performance index (CPI). These indices give a clear and concise indication of how well the project is performing. The schedule performance index calculates if the project will finish before, on, or after the planned finish date. The cost performance index calculates the cost efficiency of the project and calculates if the project is on track to finish below, on, or over the allocated budget.
- Single System – The main benefit of using EVM is that it allows project managers to track scope, cost, and time all in one system. This stops project managers from having to learn numerous systems in order to track the project performance.
- Future Performances – After obtaining the results and metrics from the EVM analysis the project manager can then see which components of the project need to be improved on. The project manager can then focus more attention on any area that is lacking and reduce the possibility of that area causing trouble again. This would help ensure improved future performances of the project.
- A common language for project professionals – EVM allows everybody involved in the managing of the project to understand to base their opinions are the same results and figures. This makes the interpretations of the results less subjective.
Conclusion:
Earned Value Management can significantly improve the project manager’s ability to monitor and analyze how the project is performing against the baseline performance. It enables them to identify the areas which are causing harm to the project’s performance and identify the areas which are falling behind schedule. EVM enables everyone in the project profession to have the same universal system of evaluating and analyzing a project’s performance while also allowing for better future predictions of how the project will perform in the future.
To find out more, contact us today!!
